I came across this issue recently when we discovered some very resource and time consuming seeks in some of our lately rolled out user databases. The users were querying articles from an article table by name.
Here’s the simplified table that I’m talking about:
| use tempdb |
Let’s pretend there are 400000 distinct articles (that’s approximately the real number, we have). The following scrip will insert 400000 rows:
| -- Insert 400000 rows. |
Now finally, we do some re-indexing just to make sure nothing like fragmented indexes or stale statistics will hamper our experiment’s results:
| -- Rebuild/create index will also generate |
I’ve created a covering index, including all of the table’s columns. Usually not a good idea but we can afford this, since the the table’s data never get modified by OLTP operations. Articles are rolled out from a master data source every two weeks, so we can have plenty of indexes simply for speeding up article searches. (We do bulk loads and index rebuilds.) Of course, you may object that I could have created the clustered index on the catalog_name column. Yes, may be a good idea. I come back to this later.
Let’s switch on statistics io and statistics time counters to get an idea of how many reads and how much time every of the following queries need:
| set statistics io on |
Ok, everything is set now. Since we’ve just performed an index rebuild, we should also be sure that all of our data- and index pages reside in the buffer pool. We’re ready to perform some searches and look at execution plans and the required number of reads. Here’s the first query:
| select catalog_name, filler |
Nothing special here. The number of reads is 6 and as expected, the covering index is utilized. This is also, what the execution plan reveals:
Very good! That’s the best plan we can get for the invoked query. The execution time is hardly measurable. It’s about 1ms on my machine, where CPU utilization does not even appear. (It says 0ms, so I suppose it’s simply somewhat lost in the general noise floor.)
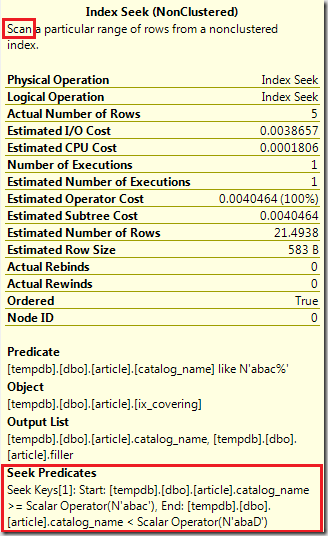
The operator information for the Index Seek exposes a slightly little detail:
The seek actually is a range scan, so the Index Seek scans a range of rows from the index. That is, the seek starts at a particular minimum value and then subsequently scans all leaf level rows in an ordered sequence until the predicate’s condition isn’t complied any more. To determine which rows will fulfill the predicate, a maximum value for the range scan is determined. The actual minimum and maximum values are calculated by examining the provided literal for the LIKE operator which is “abac%” in our experiment. That’s an important trifle which we’ll get back to a little later on.
Unfortunately we discovered users would execute somewhat different requests. There’s a clear pattern we saw, and sadly most of the provided search strings started (and also ended) with wildcards (“%”). So, instead of looking for articles, starting with “abac”, more often than not users are looking for articles, containing “abac”. That’d be a query like this one:
| select catalog_name, filler |
Of course that’s a complete different query! We see a lot more reads (35313) and the execution plan reveals a parallel index scan this time:
The execution time is 1122 ms and the CPU utilization (with two cores) is 1997 ms, a big raise in both!
Apparently an index seek can’t be performed here, because we’re using a wildcard at the first position of the filter condition, or can it?
Let’s create a stored procedure for the search:
| if (object_id('search_articles', 'P') is not null) |
Because we expect to see varying search arguments, leading to very different row count estimations and execution plans, the procedure is created by specifying the WITH RECOMPILE hint, so an execution plan is never cached, but will always be generated when the procedure gets called.
Ok, let’s try the procedure. First we invoke a simple search, where we expect an index seek as the optimal operator:
| exec search_articles 'abac%' |
The execution plan looks pretty much the same as above, where the index seek on the existing covering index has been utilized:
We see 6 reads and again, the execution time is only about 1 ms (and another 1-2 ms for stored procedure compilation). The execution plan looks pretty much the same as before, with the exception of the now existent Constant Scan and the Compute Scalar operators. These two operators calculate minimal and maximal values for the Index Seek (or the Index Range Scan, if you like) from the provided parameter.
Let’s invoke the procedure with a wildcard as the first character for the search argument:
| exec search_articles '%abac%' |
Surprisingly, the execution plan doesn’t reveal an Index Scan this time. Although the query is the same as in our second example, where an Ad Hoc query with an identical search argument was executed, the procedure’s plan sticks to an Index Seek:
Additionally, we don’t see any parallel execution. That’s probably since an Index Seek (or Index Range Scan) has to be done sequentially, so parallel execution is simply not possible. The query took 31120 reads, 1810 ms CPU time, and 1841 ms in total. That’s a lot of reads for only 128 rows in the result set. So, is there anything we can do to lower the number of reads resp. the execution time?
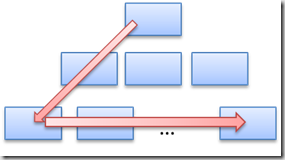
May be, we can! Think about the reason for the huge number of reads. It’s because all leaf level rows of the index have to be investigated to determine, whether a particular row matches the search condition or not. Therefore the navigation through our covering index looks like this:
That’s a scan of the whole covering index, although the plan exposes an Index Seek here! See where this leads to? We can probably lower the number number of necessary reads by creating a non covering index with catalog_name as the only column in it. In that case the Index Range Scan had to read fewer pages to find our 128 keys for an additional clustered index Key Lookup.
Let’s try this out. First, we create the non covering index:
| create index ix_noncovering on article(catalog_name) |
And now, we invoke the Ad Hoc query again:
| select catalog_name, filler |
As expected, the plan exposes an Index Seek on the non covering index to find all rows matching the predicate, and additional Key Lookups for retrieval of the missing column data:
This query took 4559 reads, about 7 times fewer than before! Unfortunately, on my machine, execution times haven’s changed much. The query still took 1830 ms with a CPU utilization of 1763 ms. But fewer reads means fewer resource usage, and also fewer blockings (latches in particular), so the result isn’t too bad at all. And this is the moment, where I’d like to mention the clustered index again. Some people would advice to create the clustered index on the catalog_name column. This is generally a good idea, when the clustered index can be utilized for seeks. When Clustered Index Scans (or Range Scans) come into play, the clustered index (since it is covering) may not be an optimal choice.
Let’s now see, how our stored procedure behaves with the new non covering index in place:
This is the call:
| exec search_articles '%abac%' |
And here’s the execution plan:
Surprisingly the plan has not changed! The non covering index isn’t utilized, although the number of reads would have been 7 times lower! So, the query still needs 31120 reads, 1905 ms total execution time, and 1872 ms of CPU utilization. When invoking the stored procedure, the covering index is always used!
Is the optimizer wrong? I don’t think so, because the optimizer uses a strategy that doesn’t care much about resource utilization – with three exceptions: time, time, and time. Minimizing the execution time is the only thing that counts for the optimizer. The optimizer is very aggressive when trying to reach the goal of minimizing execution time and thus, a query may eat up all CPU cycles, do a vastly number of reads, or burden the environment with even more greenhouse gas emission, and further increase global warming. All this topics will not be taken into account by the optimizer.
The Ad Hoc query is, by the way, more “sensitive” here. The following query:
| select catalog_name, filler |
will perform an Index Seek on the covering index, since this takes only 6 reads and is very fast.
So finally, let’s remove the covering index to see, how this affects or queries:
| drop index ix_covering on article |
Now the stored procedure can’t perform an Index Seek on the covering index any more. It has to use the non covering index instead. We’ll see some additional Key Lookups as a consequence. As long as a query returns only a handful of rows, this will need fewer reads, however. With a larger number of rows in the result set, dropping the covering index will affect the query performance negatively. So, deciding which index(es) to create is not an easy task!
The following tables summarizes all measured results:
| Search argument: "%abac%" | Query | ||||||
| Existing Indexes | Ad Hoc | Stored Procedure | |||||
| Covering Index | Non Covering Index | Reads | Execution Time | CPU Time | Reads | Execution Time | CPU Time |
| Yes | No | 35,313 | 1,122 | 1,997 | 31,120 | 1,841 | 1,810 |
| Yes | Yes | 4,559 | 1,830 | 1,763 | 31,120 | 1,905 | 1,872 |
| No | Yes | 4,576 | 1,806 | 1,747 | 4,576 | 2,092 | 2,074 |
| Search argument: "abac%" | Query | ||||||
| Existing Indexes | Ad Hoc | Stored Procedure | |||||
| Covering Index | Non Covering Index | Reads | Execution Time | CPU Time | Reads | Execution Time | CPU Time |
| Yes | No | 5 | 1 | 0 | 5 | 2 | 0 |
| Yes | Yes | 5 | 1 | 0 | 5 | 3 | 0 |
| No | Yes | 18 | 1 | 0 | 18 | 2 | 0 |
I’ve executed every experiment a few times and averaged obtained results, to ensure side effects are minimized.
Note: If you start your own experiments by using the scripts provided here, your results may vary, since the scripts operate with random values.


Unless you are in Prod, you need to add to execute DBCC DROPCLEANBUFFERS before each iteration, otherwise the results get skewed by data being cached from the 1st run.
ReplyDelete